During the hackathon I took part in in America, I built an omnichannel transcript summarisation and visualisation tool designed to make customer interaction data far more understandable and actionable. The problem we identified was that huge amounts of IVR and chatbot data were being presented in formats that weren’t user-friendly, making it difficult for teams to spot pain points or uncover meaningful opportunities for improvement. To address this, I mapped customer interactions across multiple communication channels, focusing on telephony and chatbot flows. Using detailed call flow diagrams, I visualised customer journeys, highlighted IVR pain points, summarised cross-channel experiences, and pinpointed inefficiencies that could be easily missed in raw data.
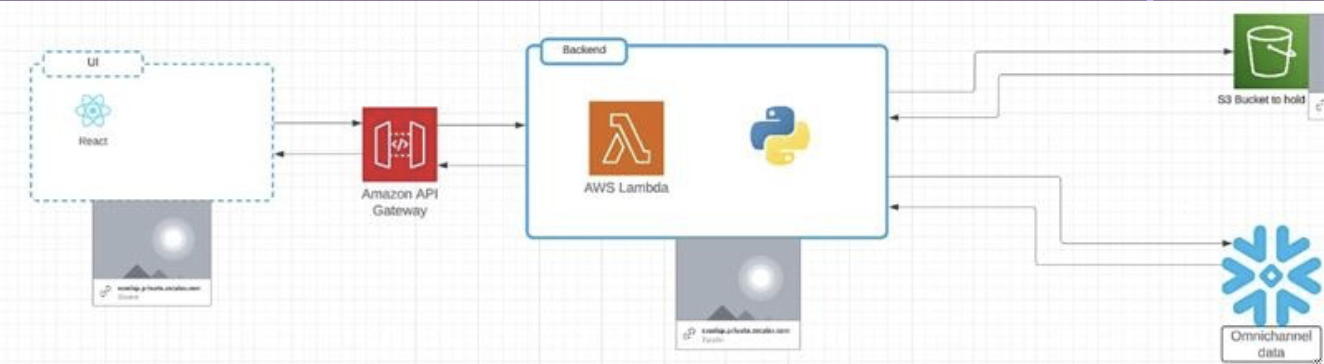
To bring the solution to life, I used a NextJS single-page application for the UI and Python AWS Lambdas managed by API Gateway for the backend. This setup allowed the tool to process customer interaction data in real time and present it through a clean, intuitive interface. The architecture also integrated seamlessly with data sources such as Snowflake and S3, making it easy to work with large volumes of omnichannel data. This project not only strengthened my technical skills in cloud development and frontend engineering but also helped me understand how meaningful insights can be extracted when data is presented in a way that teams can quickly digest and act on.